OpenClaw is slow primarily because of accumulated conversation context, insufficient RAM on your VPS or local machine, slow LLM API responses, and misconfigured Docker settings. The good news is that most of these issues are fixable without spending more money, and the performance gains can be dramatic. In my experience testing and working with AI agent frameworks, the culprit is almost always one of a handful of configuration mistakes that pile up over time and quietly kill your response speeds.
But before you start tweaking settings, it is worth understanding exactly why OpenClaw slows down in the first place. That way you are fixing root causes, not just symptoms.
What Is OpenClaw and Why Does It Get Slow?
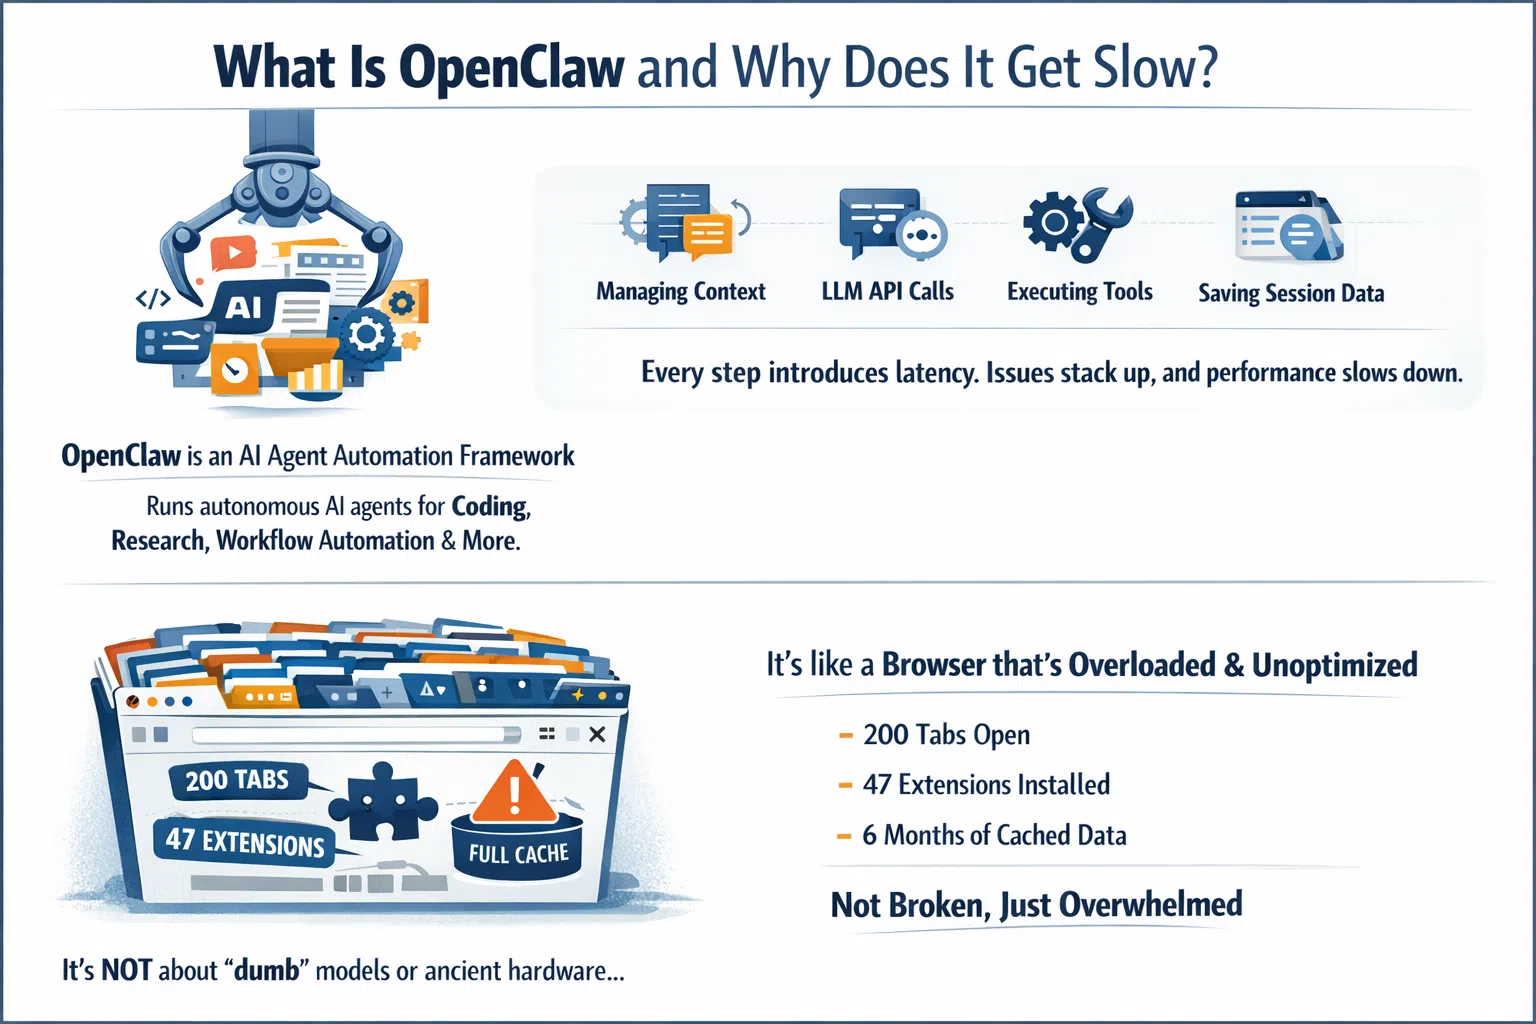
OpenClaw is a powerful AI agent automation framework that lets you run autonomous AI agents for coding, research, workflow automation, and more. It operates by managing conversation context, calling LLM APIs, executing tools, and persisting session data to disk. Every one of those steps introduces potential latency, and when several issues stack up together, the experience can go from fast and fluid to painfully sluggish in no time.
The thing most people miss is that OpenClaw slowness is not usually about the model being “dumb” or the hardware being ancient. It is about the system carrying too much unnecessary weight. Think of it like a browser with 200 tabs open, 47 extensions installed, and a cache that has not been cleared in six months. It is not broken, it is just overwhelmed.
According to the OpenClaw Low-Memory Optimization Guide on GitHub, OpenClaw context tokens accumulate up to 200,000 tokens by default, and local vector models can require 8GB or more of RAM before the system even starts doing useful work.
The Real Root Causes of OpenClaw Slowness

Before jumping into fixes, here are the core reasons OpenClaw loses speed:
1. Context accumulation: OpenClaw retains full conversation history by default. What starts as a 5,000 token conversation becomes a 150,000 token behemoth by round ten. Every single query forces the system to re-send all that history to the LLM API.
2. Insufficient RAM: The official Docker requirements call for at least 2GB of RAM. On a 1GB VPS, the container gets OOM-killed with exit code 137 or constantly hits swap memory, which makes every Node.js garbage collection cycle a visible stall to the user.
3. Slow or wrong LLM API endpoint: If your server is in Frankfurt but your LLM provider routes through us-east-1, you are adding 100 to 150 milliseconds of latency to every single tool call. That stacks fast across a multi-step task.
4. Docker cold-start overhead: Container restarts due to OOM kills mean you experience several seconds of cold start delay every time the gateway restarts.
5. Misconfigured heartbeat: Some users set their heartbeat interval to 30 seconds, which generates 120 API calls per hour even when doing nothing productive.
6. Unlimited tool output storage: Every file OpenClaw reads, every log it checks, gets stored in context. A 500-line log file adds 500 lines to your context window and stays there.
10 Tips to Speed Up OpenClaw in 2026

Tip 1: Reset Your Session Regularly
This is the single most effective and most overlooked optimization available to OpenClaw users. Resetting your session clears all accumulated conversation history, tool outputs, and intermediate results. The next session starts completely fresh without dragging along hundreds of thousands of tokens of historical baggage.
You can reset in a few different ways:
# Method 1: Command line reset

openclaw "reset session"rm -rf ~/.openclaw/agents.main/sessions/*.jsonl
/compact
My recommendation is to make session resets a habit after every independent task. Finished a debugging session? Reset. Done reviewing a pull request? Reset. It sounds overly simple, but this one habit can reduce response times by 40 to 60 percent according to real-world testing.
Tip 2: Limit Your Context Window Size
OpenClaw’s default context window supports up to 400,000 tokens. That sounds impressive, but a larger window is actually a trap. The bigger the context window, the easier it is to fill it unconsciously, and the more the LLM has to process on every single request.
A practical limit of 100,000 tokens is sufficient for the vast majority of tasks. You can set this in your config:
"maxContextTokens": 100000Unless you are doing massive refactoring across thousands of lines of code, you genuinely do not need 400K tokens of context. Trimming this setting alone can meaningfully cut your response times and API costs simultaneously.
Tip 3: Upgrade Your RAM (Or Check What You Are Using)
This one sounds obvious, but it is the most commonly missed hardware fix. The official OpenClaw Docker prerequisites require at least 2GB of RAM just for the image build. At runtime, a loaded gateway uses between 400MB and 800MB before browser automation or heavy skills are even activated.
Run this command first to check what your container is actually consuming:
docker stats --no-streamIf memory usage is above 80 percent of your total VPS RAM, hardware is your bottleneck and no amount of config tweaking will fix it. You either need to upgrade your VPS or reduce the number of concurrent agents and tools running at the same time.
Tip 4: Fix Your Heartbeat Interval
The heartbeat mechanism in OpenClaw periodically pings the API to keep the connection alive. Some users set this to 30 seconds by default, which generates 120 API calls per hour even with zero productive work happening. That is not just wasteful, it actively consumes processing resources and introduces background noise into your system.
The recommended heartbeat interval is between 5 and 10 minutes. Open your config.json file and set it like this:
"heartbeatInterval": 300000That value is 300,000 milliseconds, which equals 5 minutes. This simple change reduces background API call overhead dramatically while still keeping your connection warm for prompt caching benefits.
Tip 5: Use Smart LLM Routing (Match the Model to the Task)
Not every task needs your most powerful, most expensive model. Using a heavy model like Claude Opus for a simple formatting task or a quick code review is the equivalent of hiring a senior architect to hang a picture frame.
OpenClaw supports multi-model routing, where you assign different models to different task types:
-
Use cheaper, faster models (like Kimi 2.5 or Qwen3) for lightweight tasks, summaries, and simple queries
-
Reserve powerful models for complex reasoning, deep research, and multi-step agent chains
-
Use local embedded models for memory search operations to eliminate API costs entirely
As noted in the OpenClaw optimization guide on GitHub by OnlyTerp, defining semantic model aliases for different types of thinking is one of the most effective ways to make OpenClaw faster and smarter at the same time.
Tip 6: Enable and Leverage Prompt Caching
The Claude API (and other supported LLM backends) include a caching mechanism where identical or near-identical prompts hit a cache rather than triggering a full LLM inference pass. This can reduce costs by 30 to 50 percent for high-frequency users, and it meaningfully reduces latency on repeated or similar queries.
To maximize cache hit rates:
-
Make sure
enablePromptCaching: trueis set in your config (it should be on by default in recent versions, but always verify) -
Lower your temperature setting to around 0.2 to produce more stable, cache-friendly outputs
-
Configure your heartbeat to keep caches warm without over-pinging
Keep in mind this optimization is most valuable if you use OpenClaw heavily throughout the day. If you only interact with it a few times daily, cache TTLs may expire before you see much benefit.
Tip 7: Use Dynamic Tool Loading
By default, OpenClaw loads all tool definitions at startup, including file tools, Git tools, browser tools, and everything else in your configuration. All of these definitions consume space in your system prompt, which counts against your context window on every single request.
Dynamic tool loading means you only inject tool definitions when they are actually needed:
-
Load file operation tools only when a file task is active
-
Load Git tools only during version control operations
-
Load browser tools only when a web scraping or browsing task is triggered
This approach reduces system prompt overhead by roughly 30 percent according to performance testing. It requires a small amount of config modification but is absolutely worth the effort if you run OpenClaw heavily.
Tip 8: Choose the Right VPS Region
Network latency is one of those invisible performance killers that nobody thinks to check until they have exhausted every other option. If your VPS is hosted in Europe but your LLM provider routes requests through US East, you are adding between 100 and 150 milliseconds of extra network round-trip time to every single tool call in your agent chain.
For a multi-step agent doing six tool calls, that could mean 600 to 900 milliseconds of completely avoidable delay per agent run. You can check your current VPS location and measure real-world LLM API latency with these two commands:
curl ipinfo.iocurl -o /dev/null -s -w "%{time_starttransfer}\n" https://api.openai.comThe first command tells you where your VPS is physically located. The second measures the Time to First Byte from the OpenAI API, including the TLS handshake, and outputs only the clean time value without any payload noise in your terminal. Anything above 300ms signals a geographic mismatch. Moving your VPS to a region closer to your LLM provider’s primary data center is one of the best performance upgrades you can make.
Tip 9: Update OpenClaw to the Latest Version
It sounds almost too simple, but this is often the fastest fix available. The OpenClaw development team regularly ships updates that address memory leaks in the gateway process, excessive disk I/O per tool call, WebSocket connection handling inefficiencies under sustained load, and Node.js dependency updates that improve V8 heap management.
Before you spend hours diagnosing Docker configs or tweaking context window settings, check whether you are running the latest release. Many reported cases of “suddenly slow” behavior turned out to be performance regressions in older releases that were patched in the next update. Updating takes five minutes and should always be your first move.
Tip 10: Implement a MEMORY.md Architecture
This is one of the more advanced but genuinely game-changing optimizations for long-running workflows. Instead of letting context accumulate indefinitely across sessions, you use a structured MEMORY.md file to preserve important information before resetting.
The workflow looks like this:
# Before resetting, save key context

openclaw "Write key decisions, todos, and project state to MEMORY.md"openclaw “reset session”
openclaw “Read MEMORY.md and continue previous work”
This approach gives you the best of both worlds: clean, lightweight sessions that respond fast, plus continuity of important project context across resets. The OpenClaw Memory Masterclass by VelvetShark goes into excellent detail on how to structure these memory files for maximum effectiveness.
Pro Tip: Combine Tips 1, 6, and 10 as a daily workflow habit. Reset sessions between independent tasks, let prompt caching handle your repeated patterns, and maintain a lean MEMORY.md that carries only what truly matters forward. In real-world usage, this combination has reduced response times from 23 seconds down to 4 seconds and slashed API costs by over 80 percent.
OpenClaw Performance: Common Causes vs. Fixes at a Glance
Step-by-Step: Quick Performance Audit for OpenClaw
Follow these steps in order. Diagnose before you optimize.
-
Check RAM usage by running
docker stats --no-stream. If memory is above 80 percent of total VPS RAM, hardware is your primary bottleneck. -
Check container restart count with
docker ps -a. A restart count above zero means your container is crashing due to OOM kills or errors. -
Check your VPS location with
curl ipinfo.ioand compare it to your LLM provider’s primary region. -
Measure LLM API latency with
curl -o /dev/null -s -w "%{time_starttransfer}\n" https://api.openai.com. Anything over 300ms signals geographic mismatch. -
Check your OpenClaw version against the latest GitHub release. Update if you are behind.
-
Check disk I/O with
iostat -x 1 5. If percent utilization is above 70 percent, disk is a bottleneck. -
Run
/compactor reset your session and test response speed immediately after. -
Review your heartbeat setting in your
config.jsonfile. Confirm"heartbeatInterval"is set to300000(5 minutes). -
Check your context window setting and reduce to 100,000 tokens if it is set higher.
-
Review your loaded tools and disable any that you do not actively use in your current workflow.
For a video walkthrough of these optimization settings, This OpenClaw optimization breakdown on YouTube covers the specific configuration settings that most users get wrong, including loop protection, context window tuning, and smart LLM routing setup.
OpenClaw in 2026: What Has Changed
The 2026 landscape for OpenClaw users looks quite different from even a year ago. Multi-model routing has become significantly more accessible, with cheaper and faster models like Kimi 2.5 and Qwen3 now serving as strong daily drivers for most routine tasks. The community has largely moved toward a tiered model strategy rather than defaulting to the most capable model for everything.
Memory architecture has also matured considerably. The MEMORY.md pattern has become close to a community standard, and built-in compaction tools have improved to the point where long-running agents can maintain continuity across sessions much more reliably than before. The combination of smarter compaction and structured memory files means you can now run lean, fast sessions without sacrificing project continuity.
RAM requirements have crept up as OpenClaw has grown in capability. What was adequate on a 2GB VPS in 2025 may now require 4GB for comfortable operation with heavy tool use and browser automation enabled. If you have been on the same hosting plan for over a year and things have gradually slowed down, the platform itself has grown and your hardware may simply need to catch up.
Frequently Asked Questions
Why is OpenClaw so slow on my VPS?
The most common cause is insufficient RAM. OpenClaw requires at least 2GB of RAM based on official Docker prerequisites, and at runtime a loaded gateway uses between 400MB and 800MB before heavy tools are activated. On a 1GB VPS, the process gets OOM-killed or constantly hits swap memory. Run docker stats --no-stream to check your memory usage immediately.
How do I fix OpenClaw high latency?
Start by checking the geographic distance between your VPS and your LLM API provider. If your RTT to the API is over 300ms, move your VPS to a region closer to your provider. Then reset your session to clear context accumulation, and update OpenClaw to the latest version.
Does resetting the OpenClaw session lose important context?
You do lose the raw conversation history, but if you implement a MEMORY.md file and have OpenClaw write key decisions and project state before resetting, you preserve everything important. Most prior conversation history is irrelevant to your next task anyway.
How much RAM does OpenClaw need in 2026?
For basic usage, 2GB is the minimum. For production workflows with browser automation, multiple concurrent agents, and local vector models active, 4GB to 8GB is more realistic. Local vector models like OpenViking can require 8GB of RAM on their own.
Can I speed up OpenClaw without paying for a better VPS?
Yes, in many cases. Session resets, context window limits, heartbeat tuning, and smart model routing are all free configuration changes that can dramatically improve performance. Start with those before spending money on hardware.
What is the fastest model to use with OpenClaw?
For routine tasks, Kimi 2.5 and Qwen3 are currently among the fastest and most cost-effective options. Reserve heavier models like Claude Opus for complex multi-step reasoning tasks where the extra capability is genuinely needed.
Why does OpenClaw slow down over time during a session?
This is context accumulation. OpenClaw stores all conversation history and tool outputs in its active context window by default. As the session grows, the LLM has to process more tokens on every request. The fix is periodic session resets combined with a MEMORY.md architecture for continuity.
Is Docker overhead a major factor in OpenClaw performance?
At steady state, Docker adds negligible runtime overhead. The real issue is cold-start delay after container restarts (which take several seconds) and the build phase OOM-killing containers on under-specced hosts. Fix your RAM situation and Docker stops being a meaningful bottleneck.
Bottom Line
OpenClaw slowness almost always comes down to context bloat, underpowered infrastructure, or a handful of misconfigured settings rather than anything fundamentally broken. The ten tips above, particularly regular session resets, context window limits, heartbeat tuning, and smart model routing, can collectively transform a sluggish OpenClaw setup into one that feels genuinely fast. Start with the quick audit checklist, fix the biggest bottleneck first, and layer in the optimizations from there.